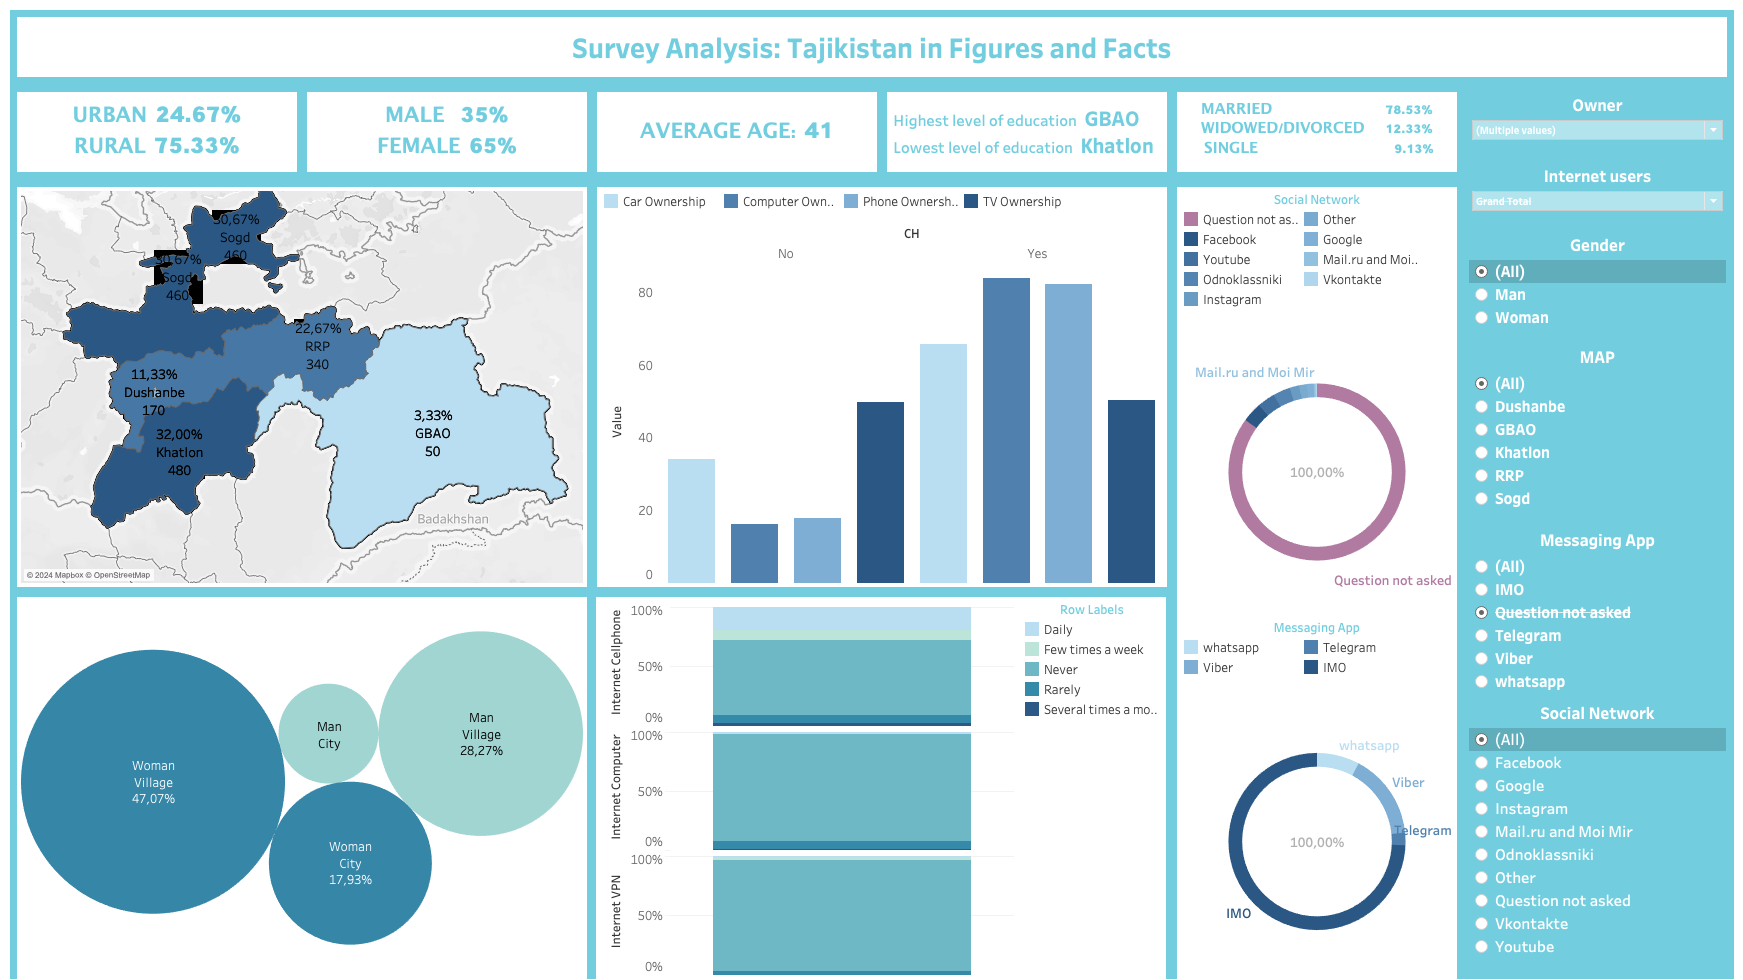
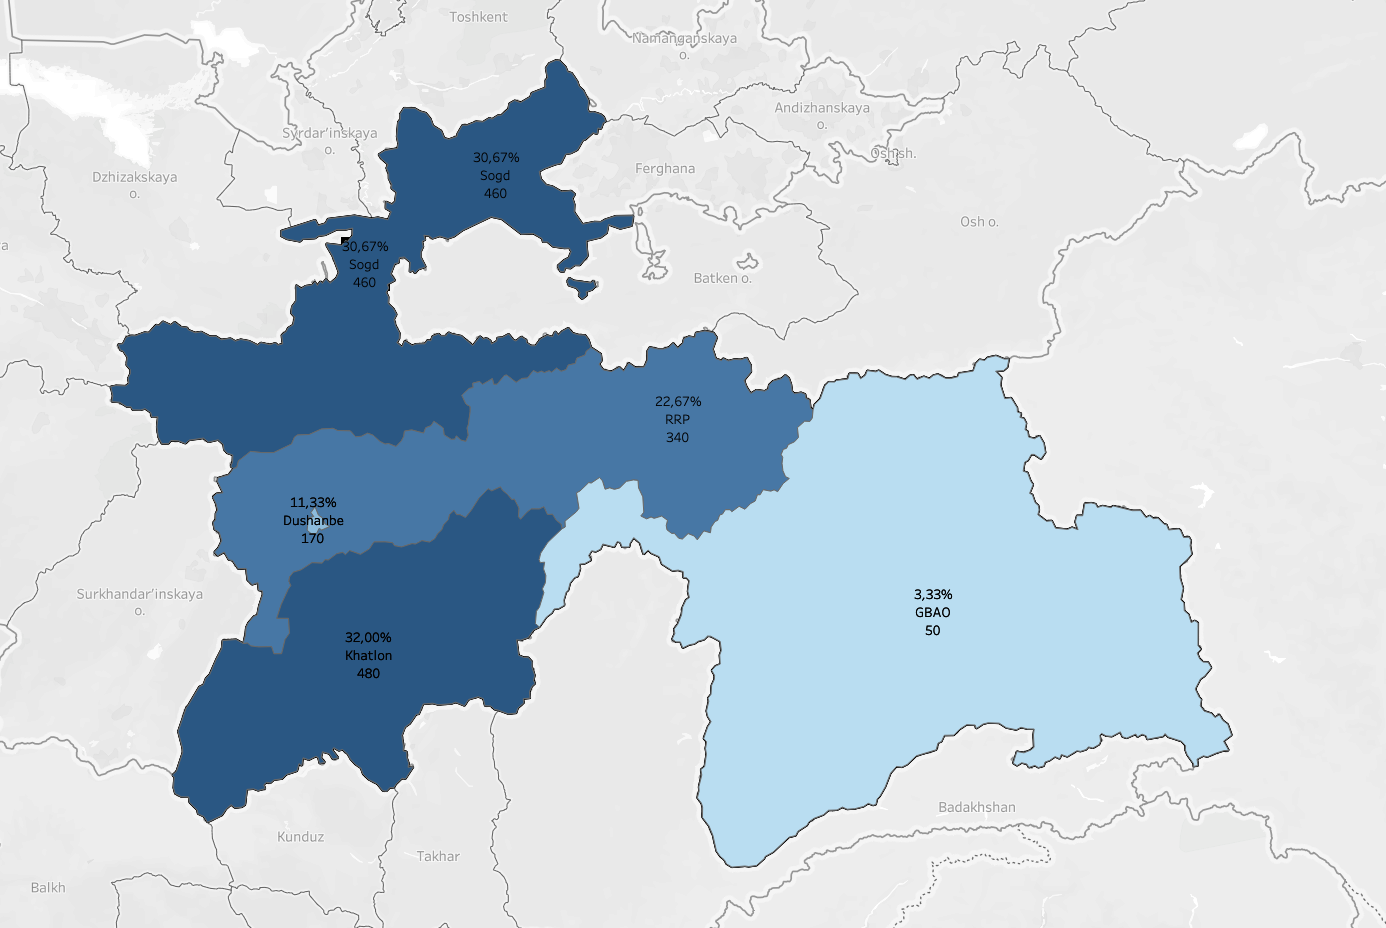
1. Number and Proportion of Citizens Surveyed by Region:
Dushanbe:
170 respondents (11.33%)
GBAO: 50 respondents (3.33%)
Khatlon: 480 respondents (32.00%)
RRP: 340 respondents (22.67%)
Sogd: 460 respondents (30.67%)
The distribution of surveyed citizens across regions is as follows:
Dushanbe: 11.33%
GBAO: 3.33%
Khatlon: 32.00%
RRP: 22.67%
Sogd: 30.67%
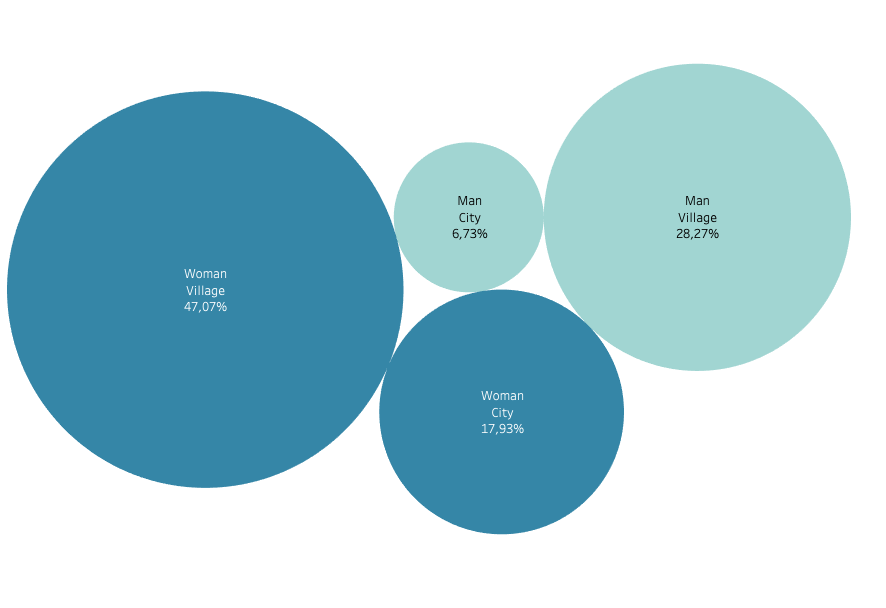
2. Number and Proportion of Citizens Surveyed by Type of Area (Urban/Rural):
City: 370 respondents (24.67%)
Village: 1130 respondents (75.33%)
The distribution of surveyed citizens across urban and rural areas is as follows:
City: 24.67%
Village: 75.33%
3. Number and Proportion of Citizens Surveyed by Gender:
Men: 525 respondents (35%)
Women: 975 respondents (65%)
The distribution of surveyed citizens by gender is as follows:
Men: 35%
Women: 65%
These results provide insights into the distribution of surveyed citizens by region, type of area, and gender. They indicate that the majority of respondents were from rural areas and that women were slightly overrepresented compared to men in the survey sample. Additionally, the distribution across regions provides an overview of the geographical coverage of the survey.
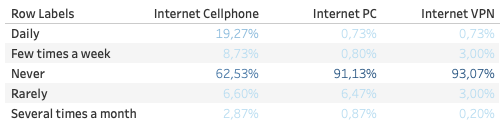
Access to the Internet by Region:
The table provides data on access to the Internet categorized by region, including Dushanbe, GBAO, Khatlon, RRP, and Sogd.
The highest number of respondents with access to the Internet via a computer, mobile phone, and VPN is in Khatlon region, while the lowest is in GBAO.
Across all regions, the majority of respondents access the Internet through their mobile phones, with varying percentages depending on the region.
Access to the Internet by Terrain:
The data also categorizes access to the Internet by terrain, distinguishing between city and village areas.
In both city and village areas, the mobile phone is the most common device used to access the Internet, followed by computers.
There are variations in VPN usage across different terrains, with some regions and terrains having higher percentages of VPN usage than others.
Access to the Internet by Gender:
Access to the Internet is analyzed by gender, with separate data provided for men and women in each region and terrain.
Across all regions and terrains, women generally have a slightly lower percentage of access to the Internet through computers and VPN compared to men.
The percentage of access to the Internet through mobile phones is relatively consistent between men and women across different regions and terrains.
Overall, the provided table offers detailed insights into how citizens in different regions and terrains access the Internet using various devices and technologies, as well as how access patterns may vary between genders.
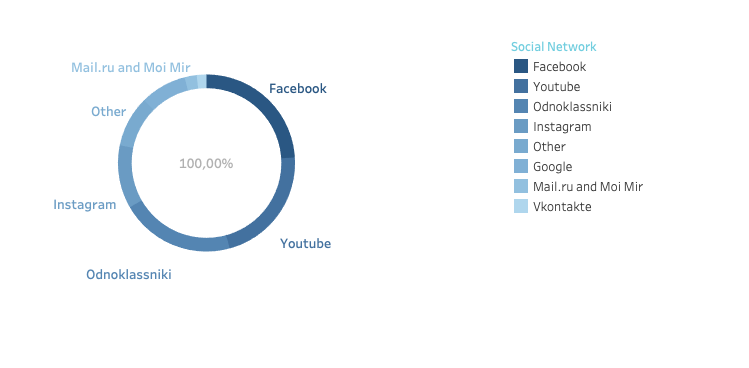
Main Social Networks, Messaging Apps, and Cellphone Internet Usage:
The most common social networks used by respondents throughout the country are Facebook, YouTube, Odnoklassniki, and Instagram.
Facebook is the most popular social network, followed by YouTube and Odnoklassniki.
A significant portion of respondents indicated that the question about social networks was not asked.
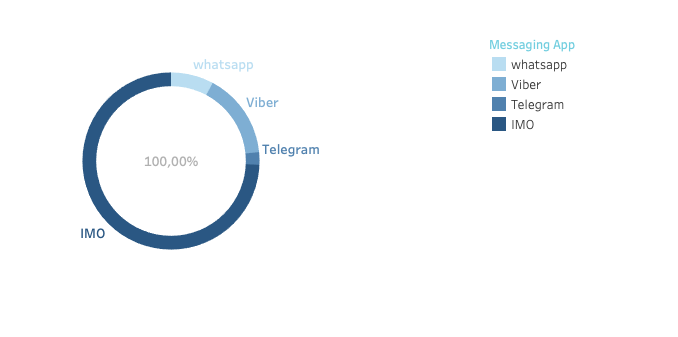
Messaging Apps:
The main messaging apps used by respondents are IMO, Viber, WhatsApp, and Telegram.
IMO is the most popular messaging app among respondents, followed by Viber and WhatsApp.
Similar to social networks, a considerable proportion of respondents did not answer the question about messaging apps.
Cellphone Internet Usage:
The majority of respondents (62.53%) reported never using the internet on their cellphones.
A smaller proportion reported using the internet on their cellphones daily (19.27%) or a few times a week (8.73%).
A minority reported rare usage (6.6%) or usage several times a month (2.87%).
Main Social Networks, Chats, and Messaging Apps by Region and Gender:
Across all regions and genders, respondents predominantly indicated that the question about social networks, chats, and messaging apps was not asked.
For cellphone internet usage, the most common response across all regions and genders was "Never."
These findings suggest that while there are certain popular social networks and messaging apps among respondents, a significant portion did not provide information about their usage patterns. Additionally, cellphone internet usage appears to be relatively low among the surveyed population, with a majority reporting never using it. Further investigation may be necessary to understand the reasons behind these patterns and their implications.
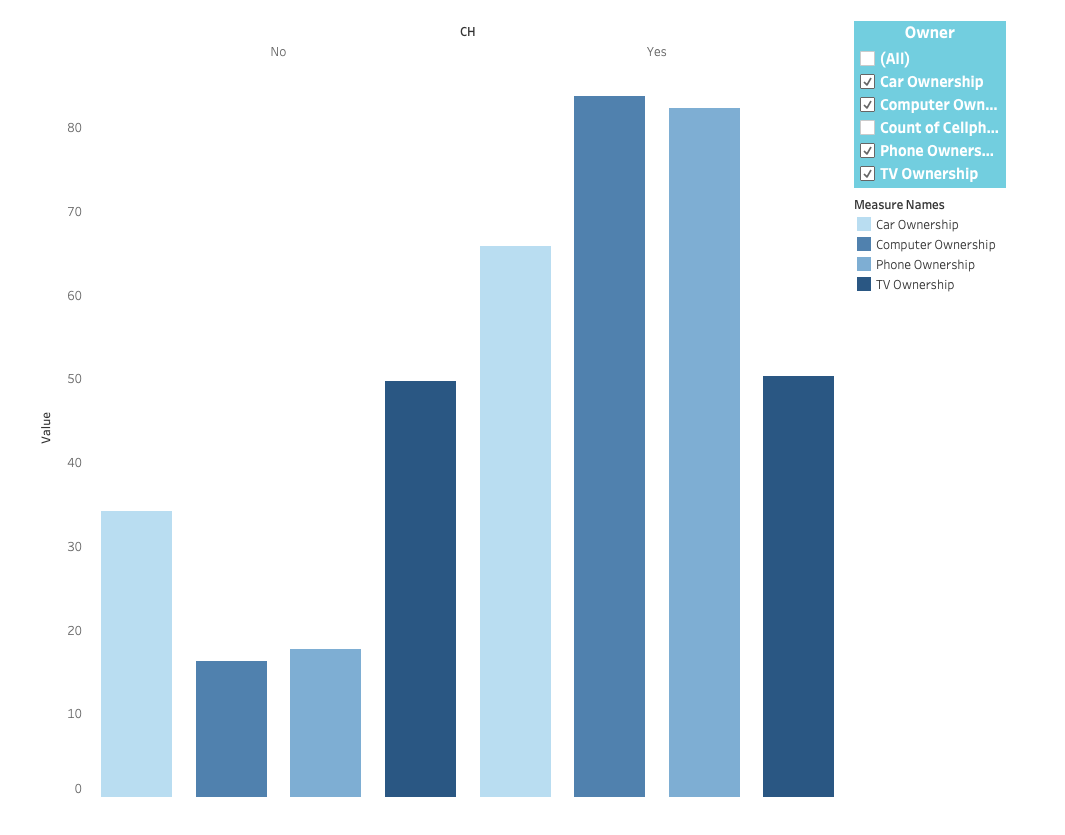
4. Ownership of Household Items:
Cellular Telephone Ownership:
Approximately 82.27% of respondents reported that their family members own cellular telephones, while around 17.73% reported no ownership. This indicates that the majority of families surveyed possess cellular telephones, suggesting widespread adoption of this technology within the surveyed population.
Computer Ownership:
The data shows that about 16.27% of respondents reported their family members owning computers, while the majority, around 83.73%, reported no ownership. This suggests a lower prevalence of computer ownership compared to cellular telephones within the surveyed population.
5. Age Distribution of Respondents:
Average Age:
The average age of all respondents is approximately 41.79 years. Among male respondents, the average age is slightly higher at 43.13 years, while among female respondents, it is slightly lower at 41.06 years.
Share of Each Age Category Across the Republic:
The age category "25-30" has the highest share across the republic, accounting for approximately 13.53% of respondents. Other prominent age categories include "18-24" (12.80%) and "31-35" (11.67%). The age category "61-65" has the lowest share across the republic, accounting for approximately 6.60% of respondents.
Share of Each Age Category by Gender:
Among male respondents, the age category "25-30" and "18-24" are equally prominent, each accounting for approximately 12.38% of respondents. Among female respondents, the age category "25-30" has the highest share, accounting for approximately 14.15% of respondents.
Share of Each Age Category by Region:
The distribution of age categories varies by region. In Dushanbe, the age category "18-24" has the highest share, while in GBAO, the age category "Over 65" has the highest share. The proportion of respondents in each age category varies across regions, indicating demographic diversity within the surveyed areas.
These findings provide insights into the age distribution of respondents across the republic, by gender, and by region, highlighting variations and patterns in demographic characteristics within the surveyed population.
6. Education Distribution:
Satellite Television Ownership:
Around 50.27% of respondents indicated that their family members have satellite television ownership, while approximately 49.73% reported no ownership. The proportion is nearly evenly split, indicating that satellite television ownership is common but not universal among the surveyed families.
Automobile Ownership:
Approximately 34.2% of respondents reported that their family members own automobiles, while around 65.8% reported no ownership. This suggests that automobile ownership is less common compared to other possessions like cellular telephones and satellite televisions within the surveyed population.
Overall, the data provides insights into the ownership patterns of various household items among the surveyed population, indicating widespread ownership of cellular telephones, moderate ownership of satellite televisions, and relatively lower ownership of computers and automobiles. These findings can inform further analysis and understanding of socioeconomic factors and lifestyle patterns within the surveyed community.
Overall Education Distribution:
The majority of respondents have finished school, accounting for approximately 50.47% of the total. About 16.4% have unfinished school education. Approximately 13.53% have completed higher education. The remaining education categories have smaller proportions, including completed vocational education, incomplete higher education, incomplete vocational education, and those without education.
Education Distribution by Gender:
Among male respondents, the most common education level is finished school, accounting for approximately 48%. Among female respondents, finished school is also the most common, with a slightly higher proportion at approximately 51.79%. There are notable differences in other education categories between male and female respondents, with varying proportions across completed higher education, completed vocational education, and other categories.
Education Distribution by Region:
The distribution of education levels varies by region. In Dushanbe, the most common education level is finished school, followed by completed higher education and unfinished school. In GBAO, completed higher education is the most common, followed by finished school and completed vocational education. Similar patterns are observed in other regions, with variations in the prevalence of different education levels.
Overall, the data provides insights into the education distribution among respondents overall, by gender, and by region, highlighting variations and patterns in educational attainment within the surveyed population.
7. Marital Status Distribution:
Overall Marital Status Distribution:
The majority of respondents are married, accounting for approximately 78.53% of the total. About 12.33% are widowed, divorced, or separated, and approximately 9.13% are single and not married.
Marital Status Distribution by Gender:
Among male respondents, the majority are married, accounting for approximately 86.10%. Among female respondents, although the majority are also married, the proportion is slightly lower at approximately 74.46%. Female respondents have a higher proportion of being widowed, divorced, or separated compared to male respondents.
Marital Status Distribution by Age Group:
The proportion of married respondents tends to increase with age, peaking among respondents aged 41-45 and gradually declining among older age groups. Conversely, the proportion of widowed, divorced, or separated respondents tends to increase with age, reaching its peak among respondents over 65 years old. The proportion of single, not married respondents shows some fluctuations across different age groups but generally remains relatively low compared to married respondents.
Marital Status Distribution by Education Level:
Respondents with higher education levels, such as completed higher education or completed vocational education, tend to have higher proportions of being married. On the other hand, respondents with lower education levels, such as incomplete higher education or without education, have lower proportions of being married and higher proportions of being widowed, divorced, or separated.
These findings provide insights into the marital status distribution among respondents, indicating variations and patterns based on gender, age group, and education level within the surveyed population.
Report: Analysis of Survey Data from Citizens of Tajikistan
Introduction:
This report presents an analysis of survey data collected from citizens of Tajikistan. The survey aimed to gather insights into various aspects of the population, including demographic characteristics, access to technology, ownership patterns, education levels, and marital status. Data was collected across different regions and demographics to provide a comprehensive overview of the Tajikistani population.
Key Findings:
1. Demographic Distribution:
The survey collected responses from citizens across different regions, with significant representation from Dushanbe, Khatlon, Sogd, RRP, and GBAO.
Rural areas showed a higher proportion of respondents compared to urban areas, with women slightly overrepresented compared to men.
2. Access to Technology:
Mobile phones were the most common devices for accessing the Internet across both urban and rural areas, followed by computers.
There were variations in VPN usage across different regions and terrains, with some areas showing higher VPN usage than others.
3. Social Media and Messaging Apps:
Facebook, YouTube, Odnoklassniki, and Instagram were the most commonly used social networks.
Messaging apps like IMO, Viber, WhatsApp, and Telegram were also popular among respondents.
Cellphone internet usage appeared to be relatively low, with a majority reporting never using it.
4. Household Item Ownership:
Cellular telephone ownership was widespread among surveyed families, followed by satellite television ownership.
Computer ownership showed a lower prevalence compared to cellular telephones.
Automobile ownership was less common compared to other possessions.
5. Demographic Characteristics:
The average age of respondents was approximately 41.79 years, with slight variations between genders and regions.
The age category "25-30" had the highest share across the republic.
Educational attainment varied across regions, with finished school being the most common education level.
Respondents with higher education levels tended to have higher proportions of being married.
Conclusion:
The survey data provides valuable insights into the demographic composition, access to technology, ownership patterns, and socio-economic characteristics of citizens in Tajikistan. These findings can inform policymakers, researchers, and organizations working in Tajikistan about the needs and preferences of the population, aiding in the development of targeted interventions and initiatives.
 Projects
 Read More